Following are descriptions of each option on the three tabs selected from the Feature Selection dialog.
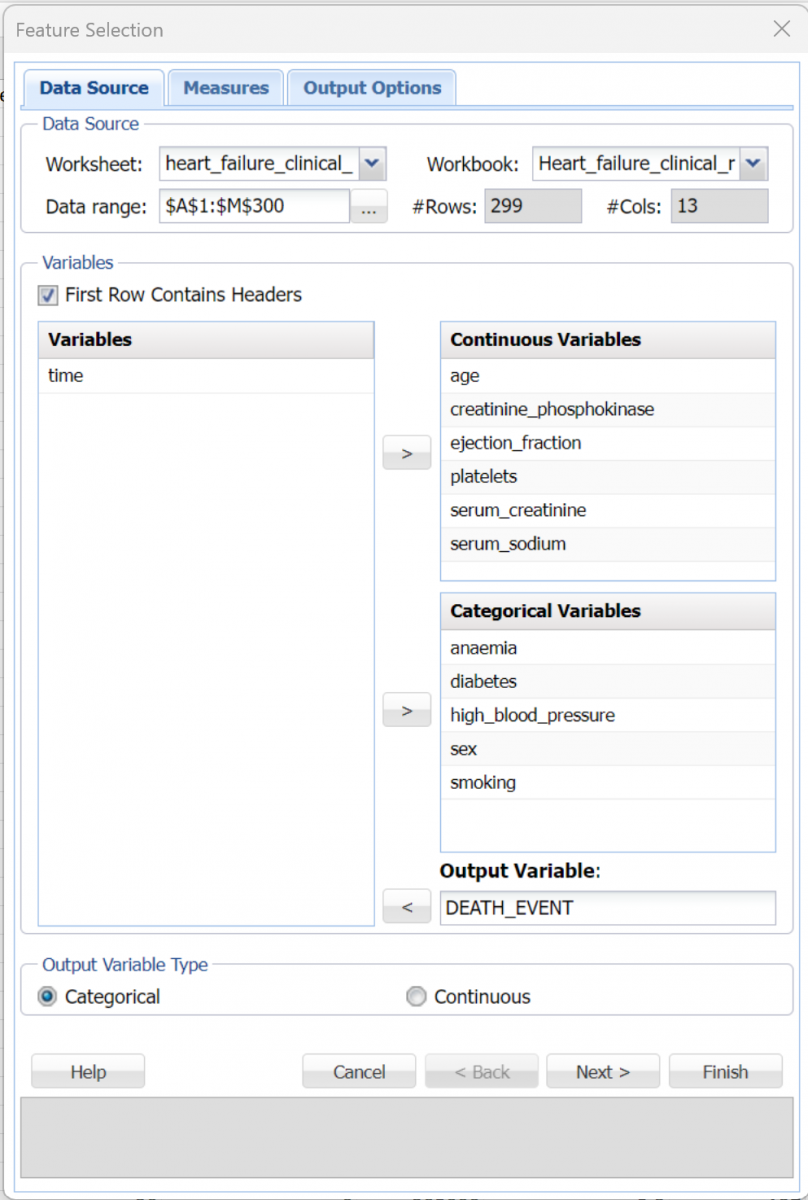
Variables Listbox
Variables (or features) included in the data set are listed here.
Continuous Variables
Place continuous variables from the Variables list to be included in Feature Selection by clicking the > command button. Feature Selection will accept all values for continuous variables except non-numeric values.
Categorical Variables
Place categorical variables from the Variables list to be included in Feature Selection by clicking the > command button. Feature Selection will accept non-numeric categorical variables.
Output Variable
Click the > command button to select the Output Variable. This variable may be continuous or categorical. If the variable contains more than 10 unique values, the output variable will be considered continuous. If the variable contains less than 10 unique values, the output variable will be considered categorical.
Output Variable Type
If the Output Variable contains more than 10 unique values, Continuous will be automatically selected and options relevant to this type of variable will be offered on the Measures tab. If the Output Variable contains 10 or less unique values, Categorical will be automatically selected and options relevant to this type of variable will be offered on the Measures tab. The default selection can always be overridden by knowledge of the output variable.
Only some of these metrics can be used in any given application, depending on the characteristics of the input variables (features) and the type of problem. In a supervised setting, if we classify data science problems as follows:
- Rn → R: real-valued features, prediction (regression) problem
- Rn → {0,1}:: real-valued features, binary classification problem
- Rn → {1...C}: real-valued features, multi-class classification problem
- {1...C}n → Rn: nominal categorical features, prediction (regression) problem
- {1...C}n → {0, 1} nominal categorical features, binary classification problem
- {1...C}n → {1...C}: nominal categorical features, multi-class classification problem
Pearson, Spearman, and Kendall
Metrics can be applied naturally to real-valued features in a prediction (regression problem)
Welch's Test
Features or outcome variables must be discretized before applying filter to real-valued features in a prediction (regression) problem
Metrics can be applied naturally to real-valued features in a binary classification problem
F-Test, Fisher, and Gini
Features or outcome variables must be discretized before applying filter to real-valued features in a prediction (regression) problem
Metrics can be applied naturally to real-valued features in a binary classification problem
Metrics can be applied naturally to real-valued features in a multi-class classification problem
Chi-squared, Mutual Info, & Gain Ratio
Features or the outcome variables must be discretized before applying filter to real-valued features in a prediction (regression) problem
Features or the outcome variable must be discretized before applying filter in a binary classification problem
Features or the outcome variable must be discretized before applying filter in a multi-class classification problem
Features or the outcome variable must be discretized before applying filter in a prediction (regression) problem with nominal categorical features
Metrics can be applied naturally to real-valued features in a binary classification problem with nominal categorical features
Metrics can be applied naturally to real-valued features in a multi-class classification problem with nominal categorical features
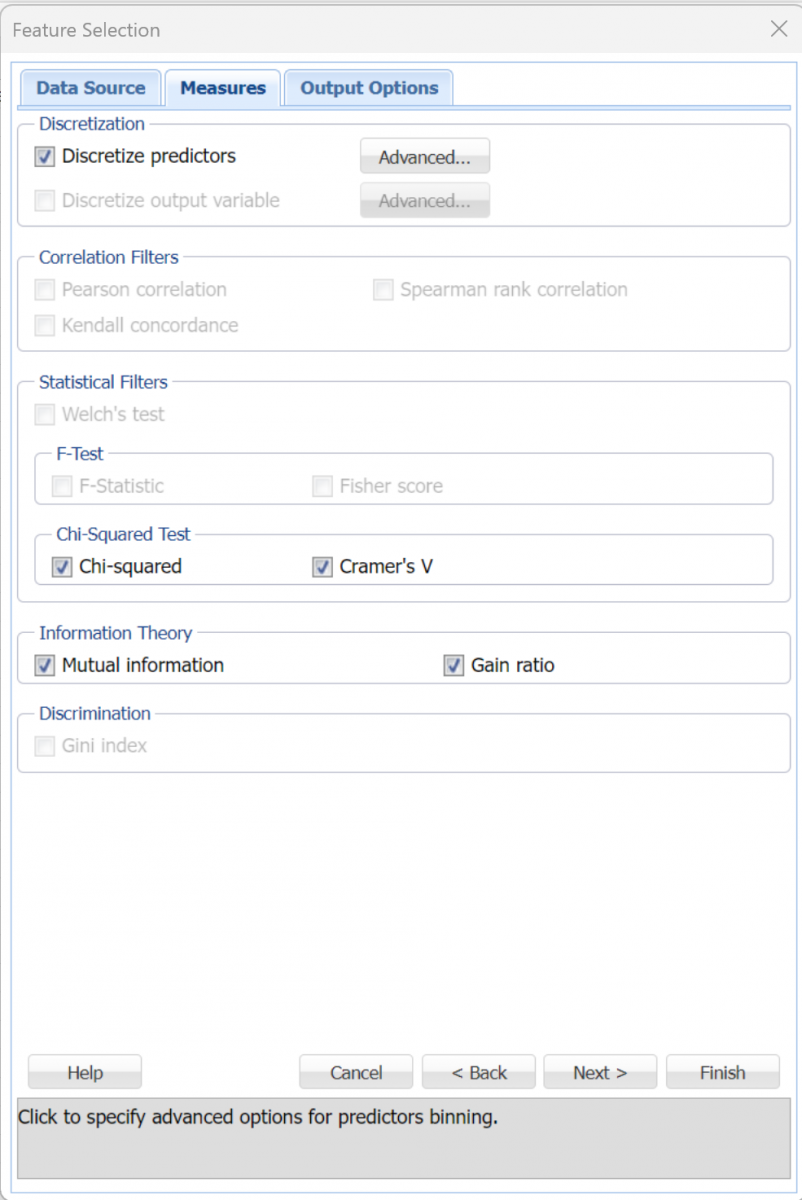
Discretize predictors
When this option is selected, Analytic Solver Data Science transforms variables listed under Continuous Variables on the Data Source tab into categorical variables.
Click the Advanced button to open the Predictor Discretization - Advanced dialog. Here the Maximum number of bins can be selected. Analytic Solver Data Science assigns records to the bins based on whether the variable's value falls within the interval of the bin (if Equal interval is selected for Bins to be made with), or on an equal number of records in each bin (if Equal Count is selected for Bins to be made with). These settings are applied to each of the variables listed under Continuous Variables on the Data Source tab.

Discretize output variable
When this option is selected, Analytic Solver Data Science transforms the continuous output variable, listed under Output Variable on the Data Source tab, into a categorical variable.
Click the Advanced button to open the Output Discretization - Advanced dialog. Here the Maximum # bins can be selected. Analytic Solver Data Science assigns records to the bins based on whether the output variable's value falls within the interval of the bin (if Equal interval is selected for Bins to be made with), or on an equal number of records in each bin (if Equal Count is selected for Bins to be made with). These settings will be applied to the variable selected for Output Variable on the Data Source tab.

Pearson correlation
The Pearson product-moment correlation coefficient is a widely-used statistic that measures the closeness of the linear relationship between two variables, with a value between +1 and -1 inclusive, where 1 indicates complete positive correlation, 0 indicates no correlation, and -1 indicates complete negative correlation.
Spearman rank correlation
The Spearman rank correlation coefficient is a non-parametric measure that assesses the relationship between two variables. This measure calculates the correlation coefficient between the ranked values of the two variables. If data values are repeated, the Spearman rank correlation coefficient will be +1 or -1, if each of the variables is a perfect monotone or non-varying function of the other.
Kendall concordance
Kendall concordance, also known as Kendall's tau coefficient, is used to measure the level of association between two variables. A tau value of +1 signifies perfect agreement and a -1 indicates complete disagreement. If a variable and the outcome variable are independent, then one could expect the Kendall tau to be approximately zero.
Welch's test
Welch's Test is a two-sample test (i.e., applicable for binary classification problems) that is used to check the hypothesis that two populations with possibly unequal variances have equal means. When used with the Feature Selection tool, a large T-statistic value (in conjunction with a small p-value) would provide sufficient evidence that the Distribution of values for each of the two classes are distinct and the variable may have enough discriminative power to be included in the classification model.
F-Statistic
F-Test tests the hypothesis of at least one sample mean being different from other sample means assuming equal variances among all samples. If the variance between the two samples is large with respect to the variance within the sample, the F-statistic will be large. Specifically for Feature Selection purposes, it is used to test if a particular feature is able to separate the records from different target classes by examining between-class and within-class variances.
Fisher score
Fisher Score is a variation of the F-Statistic. It chooses two variables that assign similar values (or assigns higher values) to samples from the same class, and different values to samples from different classes. The larger the Fisher Score value, the more relevant or important the variable (or feature).
Mutual information
Mutual information is the degree of a variables' mutual dependence or the amount of uncertainty in variable 1 that can be reduced by incorporating knowledge about variable 2. Mutual Information is non-negative and is equal to zero if the two variables are statistically independent. Also, it is always less than the entropy (amount of information contained) in each individual variable.
Gain ratio
This ratio, ranging from 0 and 1, is defined as the mutual information (or information gain) normalized by the feature entropy. This normalization helps address the problem of overestimating features with many values but the normalization overestimates the relevance of features with low entropy. It is a good practice to consider both mutual information and gain ratio for deciding on feature rankings. The larger the gain ratio, the larger the evidence for the feature to be relevant in a classification model.
Gini index
The Gini index measures a variable's ability to distinguish between classes. The maximum value of the index for binary classification is 0.5. The smaller the Gini index, the more relevant the variable.
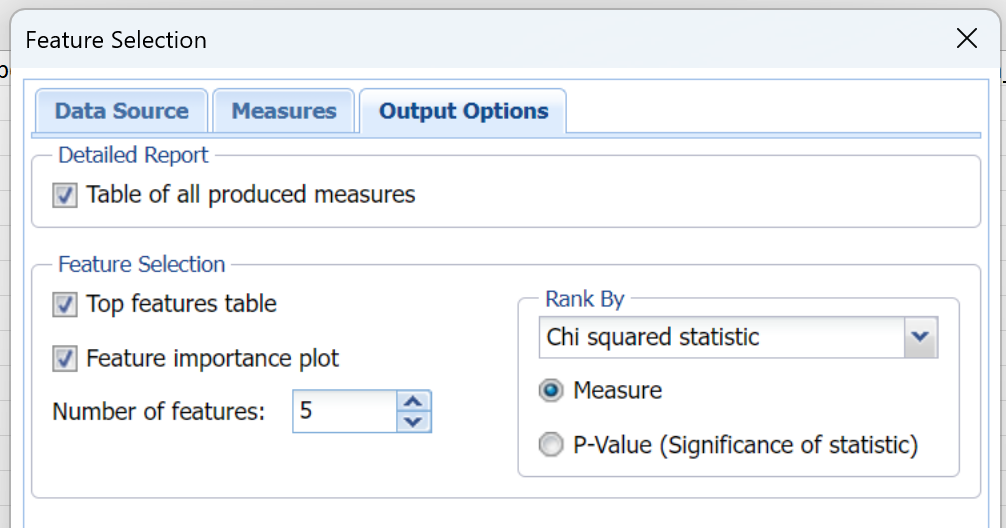
Table of produced measures
If this option is selected, Analytic Solver Data Science produces a table containing all of the selected measures from the Measures tab. This option is selected by default.
Top features table
If this option is selected, Analytic Solver Data Science produces a table containing the top number of features as determined by the Number of features edit box and the Rank By option. This option is not selected by default.
Feature importance plot
If this option is selected, Analytic Solver Data Science plots the top-most important or relevant features as determined by the value entered for the Number of features option and the Rank By option. This feature is selected by default.
Number of features
Enter a value here ranging from 1 to the number of features selected in the Continuous and Categorical Variables lists on the Data Source tab. This value, along with the Rank By option setting, is used to determine the variables included in the Top Features Table and Feature Importance Plot. This option has a default setting of 2.
Rank By
Select Measure or P-Value, then select the measure from the Rank By drop down menu to rank the variables by most important or relevant to least important or relevant in the Top Features Table and Feature Importance Plot. If Measure is selected, the variables will be ranked by the actual value of the measure or statistic selected, depending upon the interpretation (either largest to smallest or smallest to largest). If P-Value is selected, the variables will be ranked from smallest to largest using the P-value of the measure or statistic selected.